Back to Main
Debugging Memory Leaks in JavaScript
By Camilo Calvo-Alcañiz. 10-minute read. Dec 18, 2024.
Are drivers today better or worse than twenty years ago?
(I promise this question is related to JavaScript.)
In terms of road safety, the answer is pretty unequivocal—they are better, and cause far fewer fatalities than they did twenty years ago. But what about the average driver’s level of skill? Do they exhibit the focus and emotional restraint that make for pleasant commutes? How much misbehavior do you see on an average day driving around your city?
For all the safety technology these last two decades have introduced, little has changed in the way of the traits that actually matter on the road: being able to focus and being able to stay calm. Although drivers no longer have to worry about checking their blind spot (blind spot monitors), managing their speed (adaptive cruise control), being aware of the bounds of their car (collision avoidance), or even turning their heads (backup camera), they are just as liable to text, watch YouTube, brake check, and weave. With the help of technology, drivers today have license to act much more poorly.
If you are familiar with low-level and high-level programming languages, you may see where this metaphor is heading. Memory management and garbage collection, subjects that in the case of languages such as C and Rust follow clearly defined rules and require hours of dedicated learning, are simply not emphasized to the same extent in JavaScript. There’s still as much complexity going on behind the scenes, but a developer can spend months or even years working in JavaScript before having to reason about these subjects carefully.
Like with cars, the abstracting away of fundamentals gives developers license to act poorly. The famous example today is of memory overuse on browsers. Chrome has become a target of justified anger for this, but the problems extend all the way down to the websites that run on it.
For both driving and programming, there will come a moment where the safety features fall away and knowledge of the fundamentals is required. Think of getting caught in a storm on the highway, with visibility reduced to near zero. Whether your application becomes so large that it bumps up against memory limits, or you integrate it with a framework that itself doesn’t handle memory well, you will eventually need to learn the basics of memory management to solve your problems.
So let’s take a look at memory in JavaScript, from how it’s managed behind the scenes to how it can be measured and modified. I’ll walk through the garbage collection process, the tools of the trade for memory profiling, and some of the best problem-solving strategies for addressing memory leaks.
How JavaScript Handles Memory
Because universities typically teach memory management in the context of low-level languages such as C, many developers start their careers without an understanding of how high-level languages such as JavaScript deal with memory.
Like with other languages, the memory lifecycle in JavaScript follows three steps: allocation, use (reads, writes), and deallocation. As a high-level language, it handles allocation and deallocation for you. The formula for when to allocate is quite simple—whenever the user creates an “object,” such as a primitive, array, or function, some amount of memory is put aside for it. The process of deciding when to deallocate, however, is more complex.
The JavaScript Garbage Collector (GC), which is responsible for determining when to free memory, is up against a mathematical challenge. A perfect understanding of when memory should be freed is undecideable, meaning there is no formula it can follow that would perfectly optimize memory usage. Instead, it uses a series of heuristics to estimate when is the best time to prune the memory tree. When it decides it’s a good time, the GC will perform an algorithm known as “Mark and Sweep”, which descends down the object tree from the root, taking note of every object it encounters. At the end of the descent, any object in memory that isn’t accounted for is assumed to be unreachable and gets destroyed so that its memory can be reused. All JavaScript engines (and by extension all browsers) use this algorithm to manage memory.
If you are a developer who didn’t know about the “Mark and Sweep” algorithm, you may notice that it explains some of the rules you learn early on in your JavaScript career. For example, why do we have to manually remove event listeners? The answer comes from “Mark and Sweep”: the listeners act as an extra reference on the DOM elements they are attached to. If one of these DOM elements is destroyed by its parent, the reference from the event listener will keep it alive during “Mark and Sweep,” preventing it from being garbage collected and causing a memory leak.
The same principle applies to the setInterval function. In this case, setInterval acts as a reference to every variable in the lexical scope of its callback function (more information on lexical scope is available in this article on closures). In other words, until setInterval is cleaned up, all of the variables accessible to the callback function will be kept alive by the reference from the setInterval function. If you attempt to delete any of those variables, a memory leak will occur.
As mentioned in the introduction, the high memory limits on modern browsers disincentivize developers from diving this deep into JavaScript’s garbage collection process. But there are two instances where this knowledge becomes particularly important.
One is when you are writing applications that use large amounts of data—for example, those that deal with images. Even if you compress an image down to a hundred kilobytes, that’s still the memory equivalent of 27,000 words of text, about the length of Albert Camus’ The Stranger.
The other is when integrating with third-party applications, which may handle memory poorly. As you’ll see later, even if a third-party plugin is memory-safe when used individually, the combination of two or more can sometimes cause leaks.
How To Check Memory Usage
Every browser has its own suite of developer tools, and all of them include at least one that deals with memory. The examples below will use Chrome’s memory profiling tool, which I’ve found to be well-documented and easy to pick up.
No matter which tool you choose, you’ll primarily be focused on two objectives. One is to make sure your memory usage stays at a reasonable level. To put that in more quantitative terms, your website should perform as well or better than websites with similar functionality from well-known companies. I’ve profiled the memory usage for a few websites from around the internet to give you a benchmark for what that looks like:
| Application | Memory |
|---|---|
| Wikipedia on the article for “Computer” | 10.6 MB |
| Amazon’s home page | 14.3 MB |
| The New York Times home page | 44.6 MB |
| X / Twitter feed | 46.1 MB |
| Facebook feed | 68.2 MB |
| Amazon Prime Video streaming “The Holdovers” | 112 MB |
| YouTube playing an hour-long video | 145 MB |
In this table we can see three general categories of memory usage. The first are small, static pages or websites that prioritize speed above all else, such as Amazon in the shadow of the “every 100 milliseconds of latency costs 1% in revenue” study. In the middle category are your standard, text- and image-rich feeds (newspapers, social media websites, etc.), with memory in the 40-80 MB range. And finally there are video streaming websites, which get up into the 100-150 MB range. If you can get your website’s memory to outperform your category, all the better, but it’s important to at least match the standard.
The second objective for a memory profiling tool is to identify and resolve memory leaks. Chrome’s memory panel offers several views of your application’s memory, two of which are particularly useful for this goal: heap snapshots and detached elements. Let’s step through a simple demonstration to see what each view can provide you.
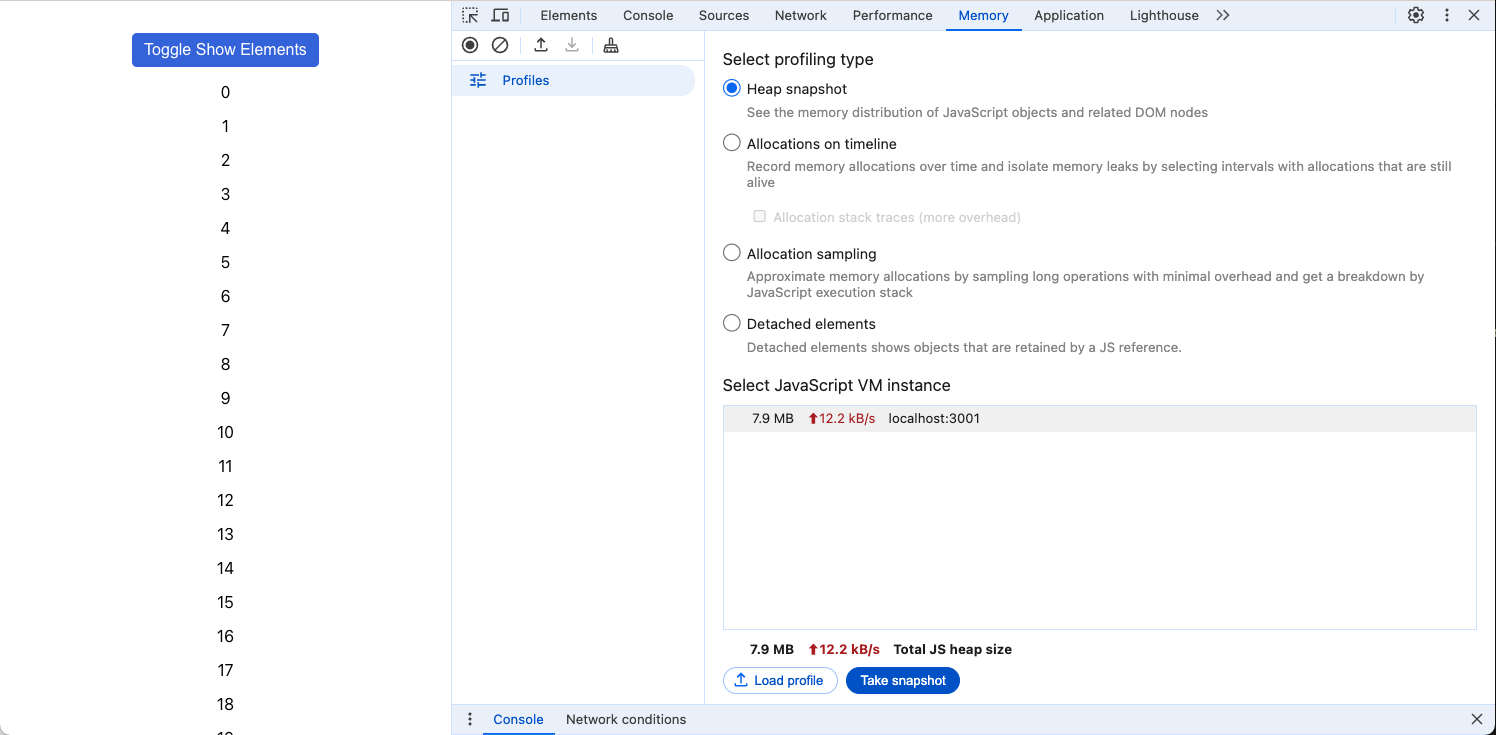
Here I’ve created a React application that renders out 1,000 divs containing numbers from 0 to 999. Each of the 1,000 divs has an associated event listener that listens for a key press. When the user clicks the button at the top, it will toggle a flag that determines whether or not to render the 1,000 divs. The effect from the user’s perspective is that the divs disappear and reappear with each button click.
In normal circumstances, you could click the button as many times as you like, and the memory would remain constant. But because the event listeners are never cleaned up, all the divs will be leaked out to memory with each toggle.
Let’s see how heap snapshots can be used to observe the memory rising. First, we take an initial snapshot:
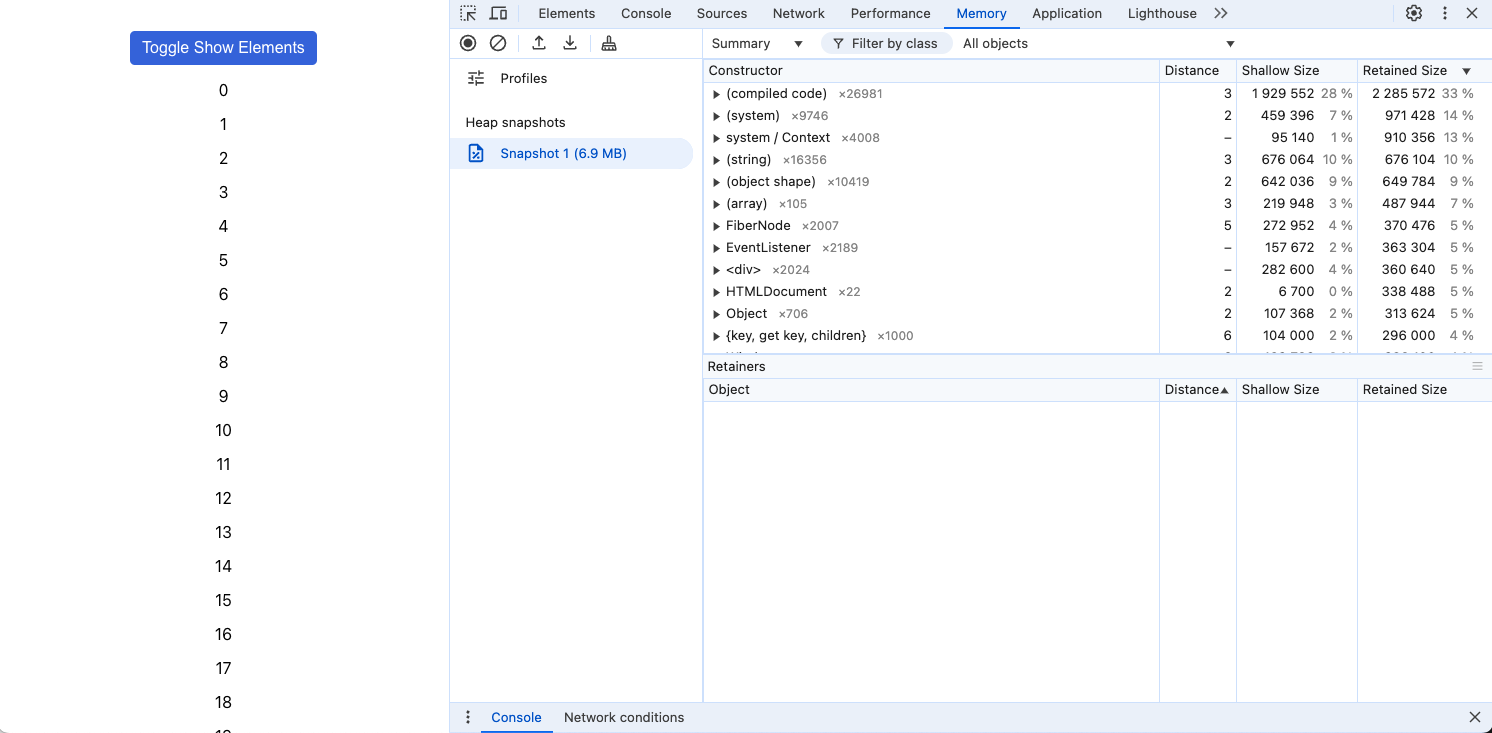
Here, we can see a list of all of the objects in the application and how much memory each one uses. Let’s hit the toggle once:
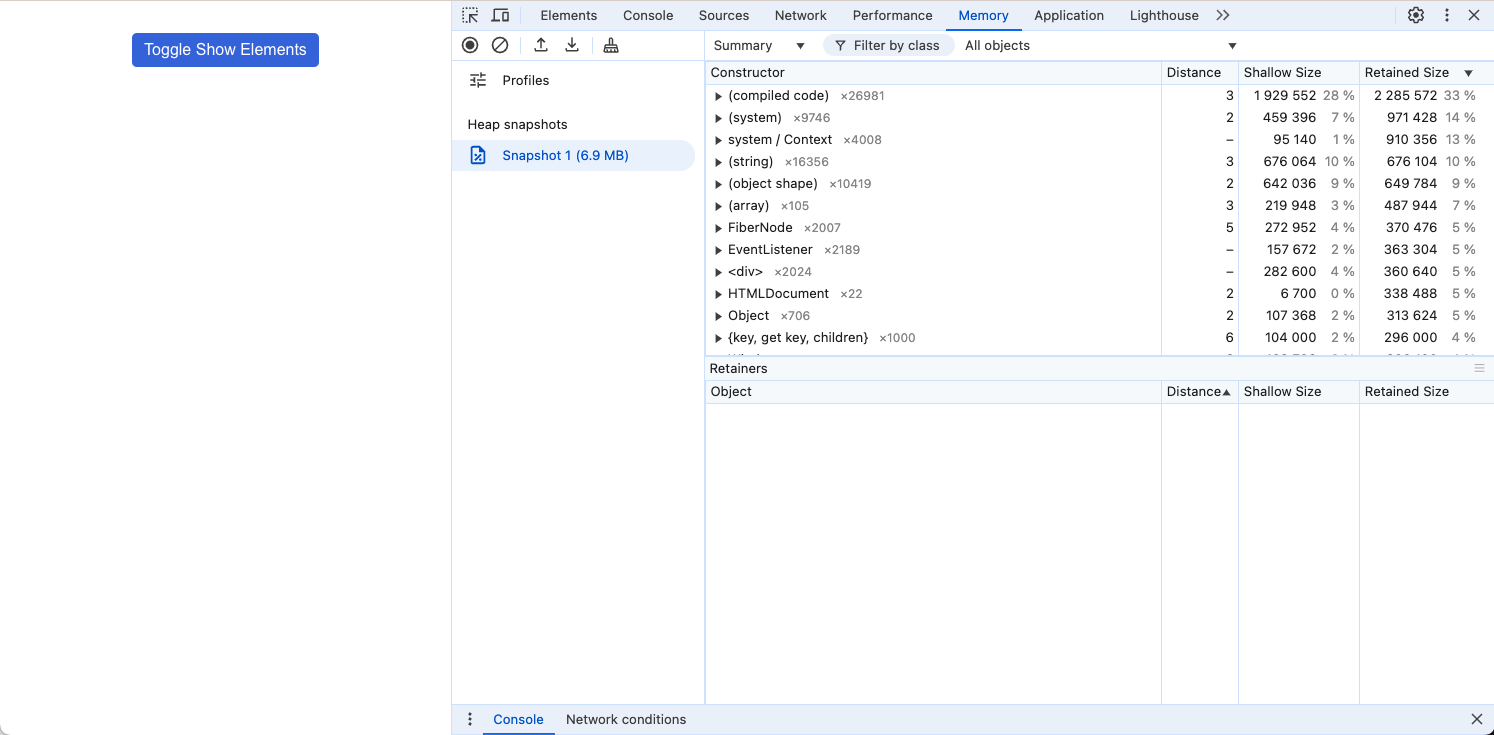
And then again, taking a second heap snapshot:
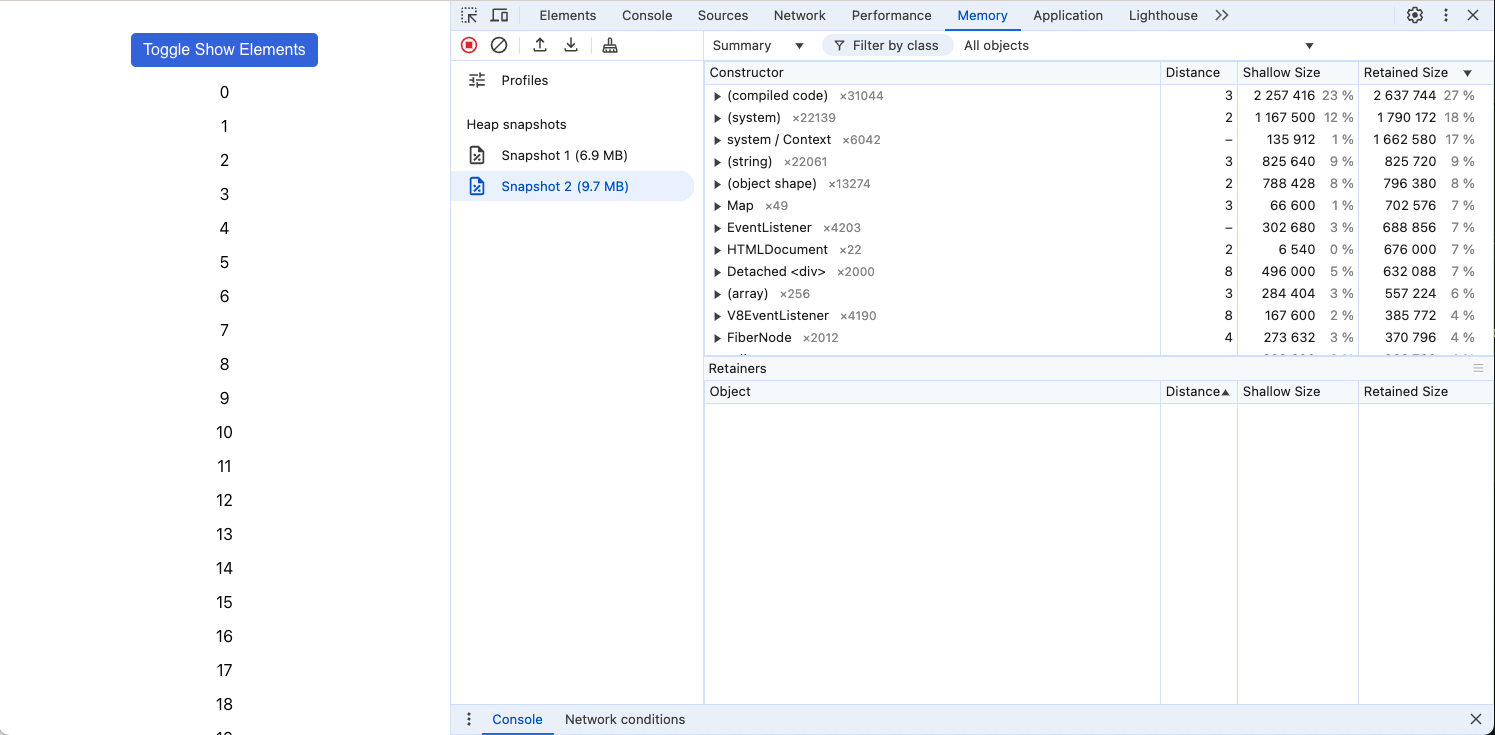
Notice that the memory usage has gone up, from 6.9 MB to 9.7 MB. Let’s hit the toggle off and on again, and then search through memory for nodes marked as “Detached”:
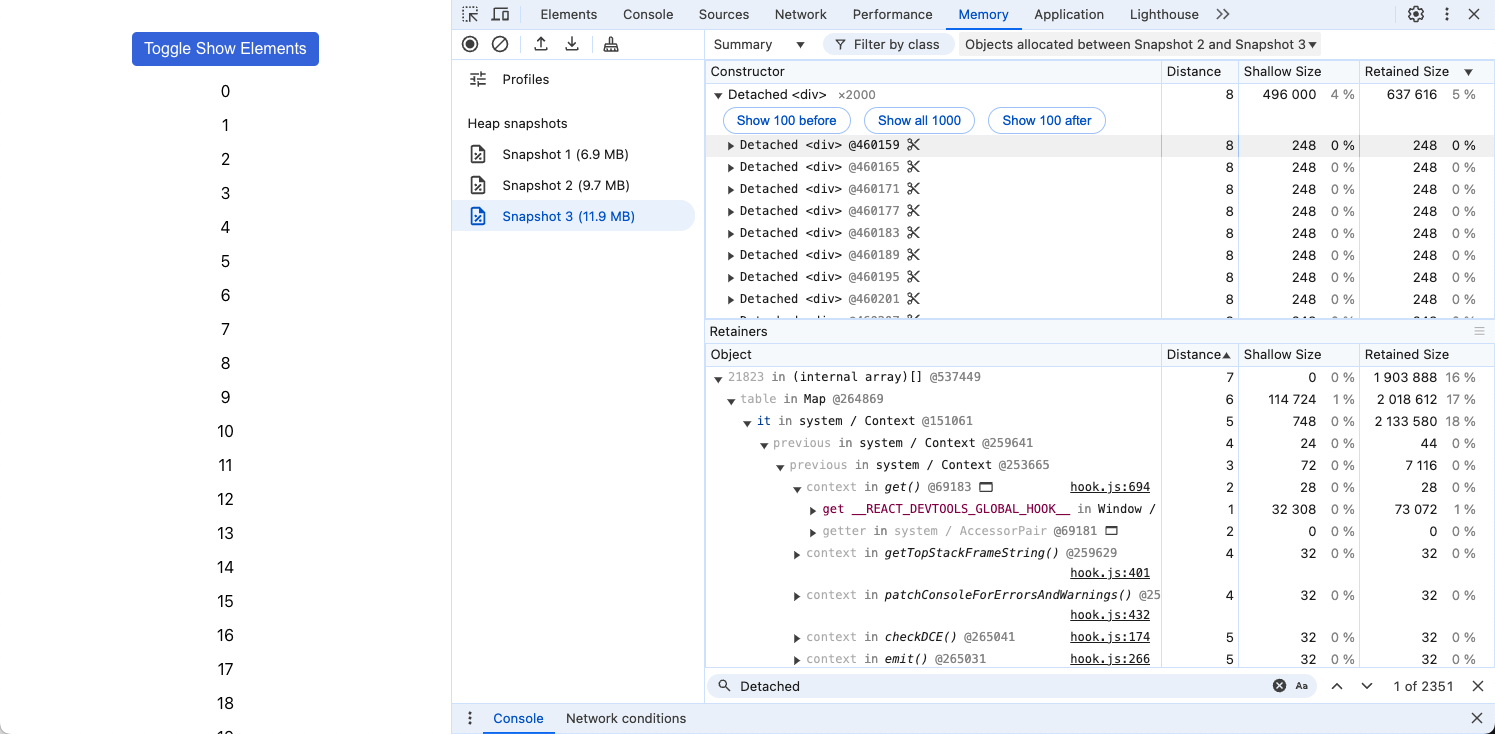
In the Constructor panel, you can see all of the divs that have been leaked out to memory, while the Retainers panel shows the chain of ownership for each one, all the way back to the root of the DOM. Also take note of the filter in the top right corner, “Objects allocated between Snapshot 2 and Snapshot 3.” If you take many snapshots, this filter can help provide clues as to when your leak occurs.
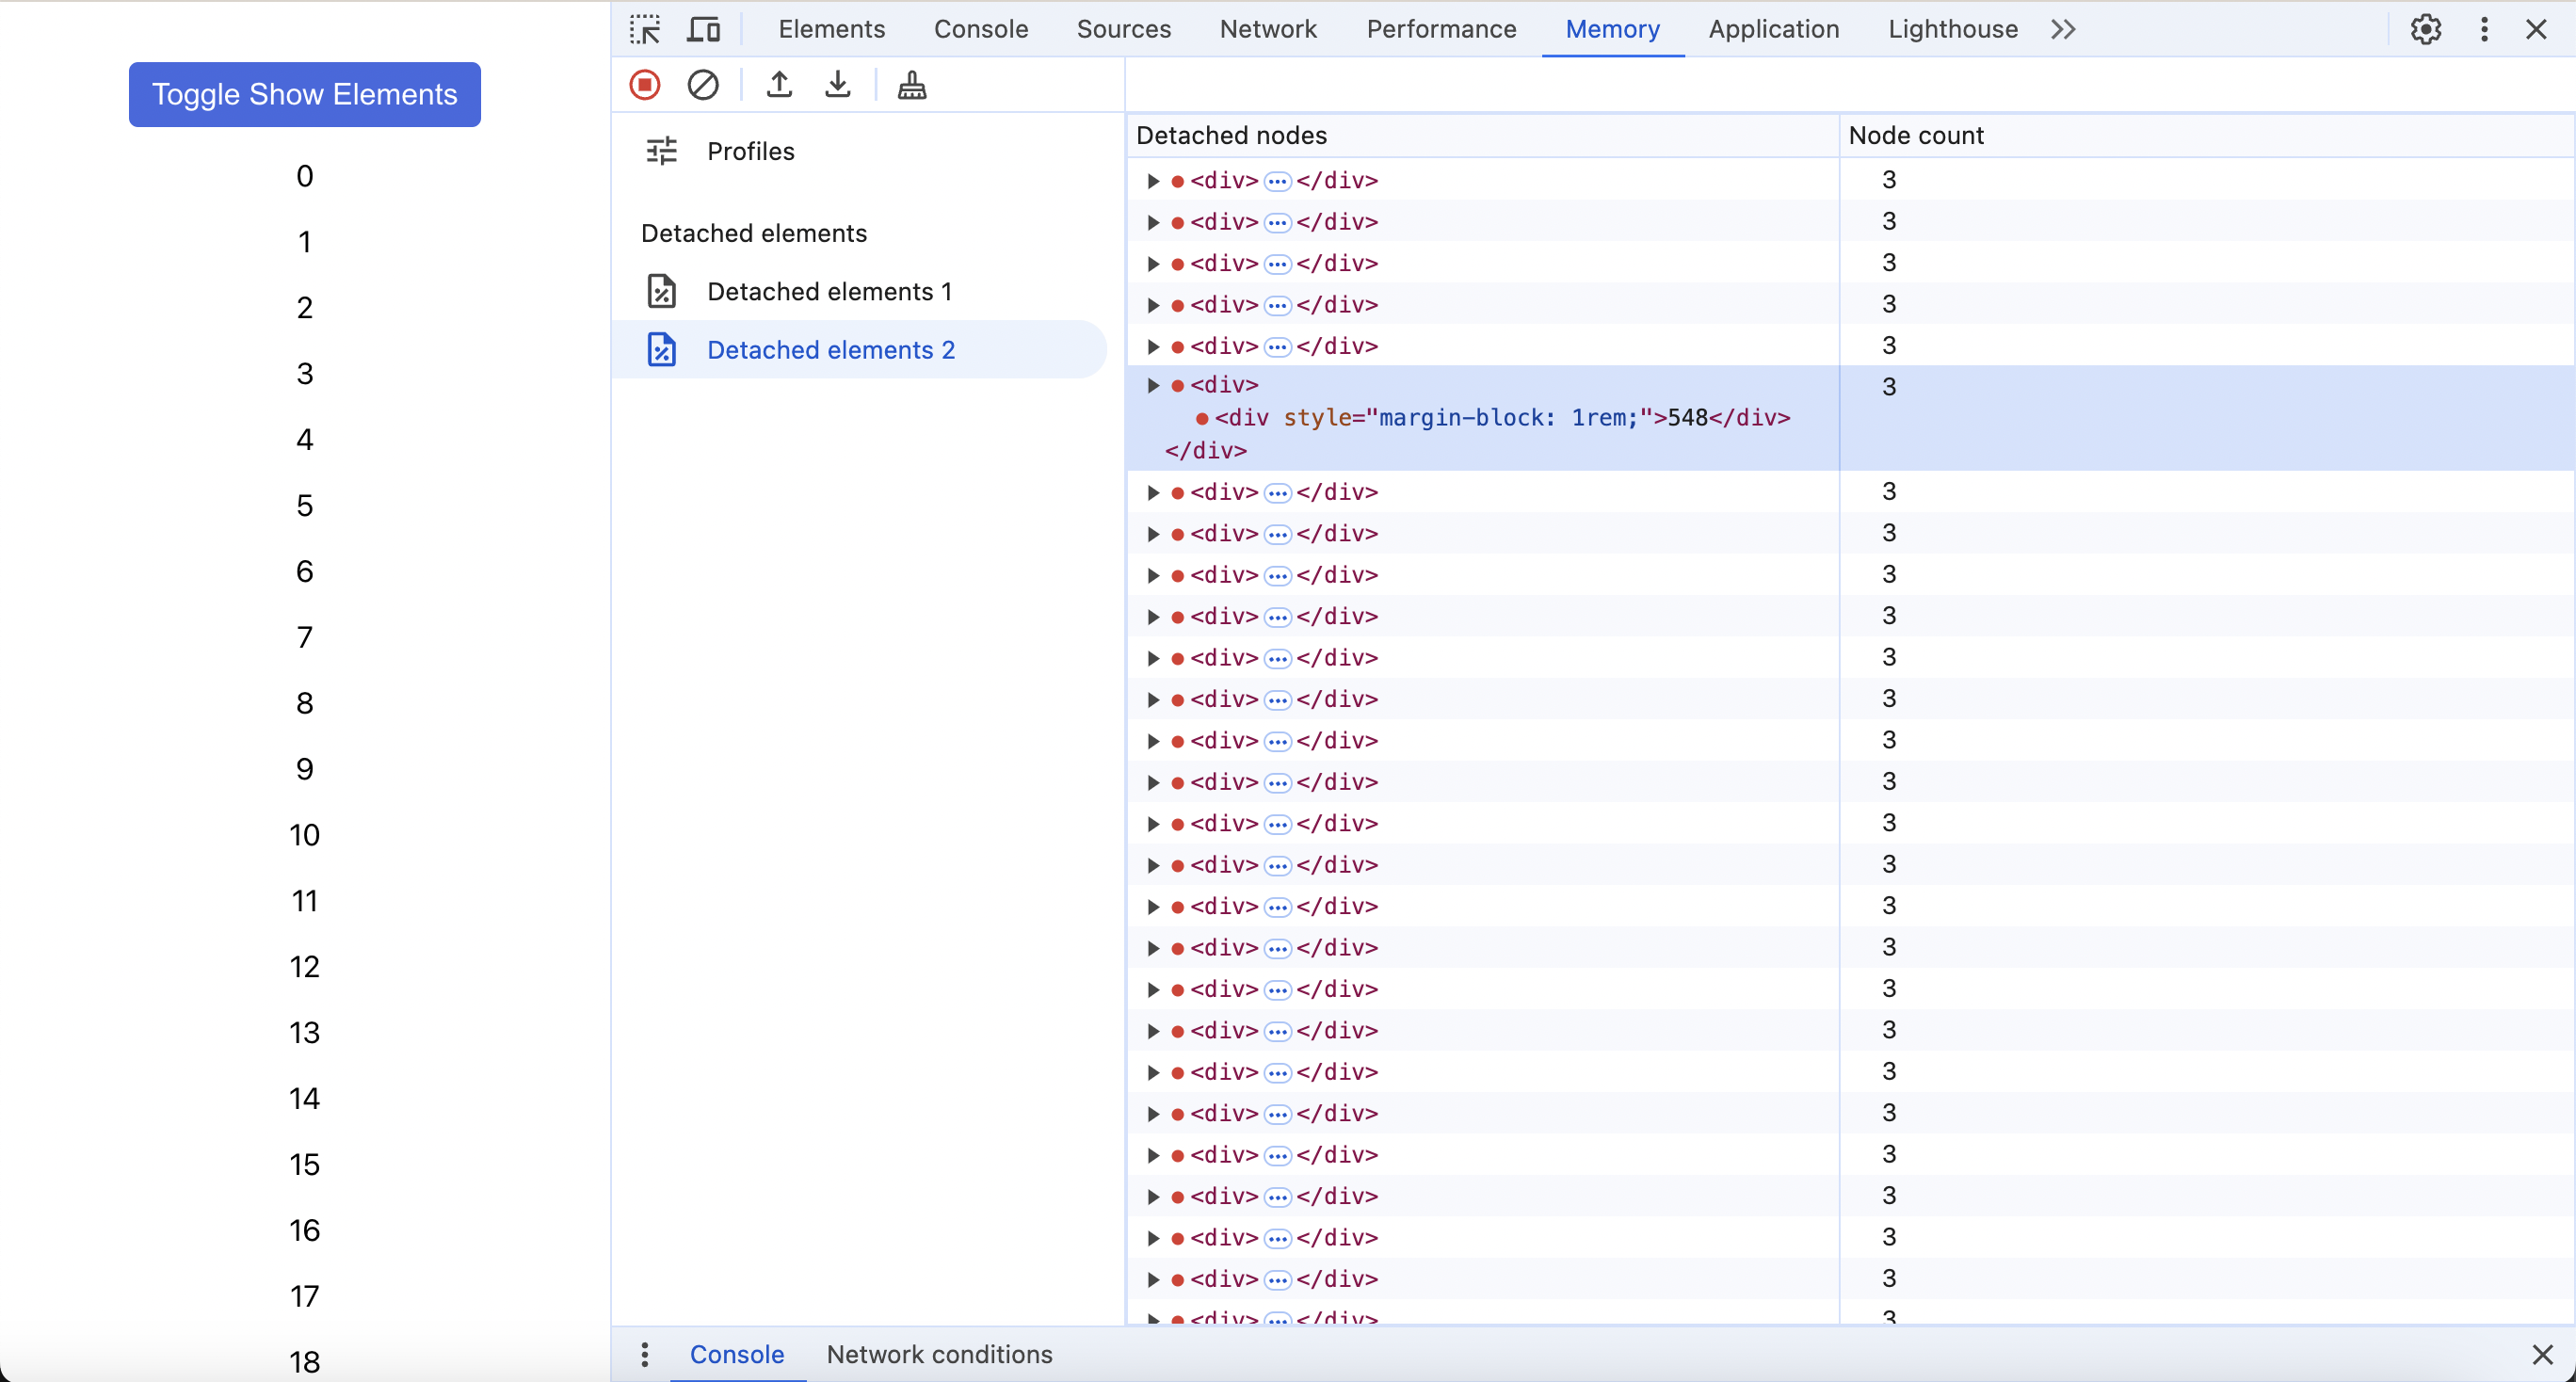
However, there is a more direct way to find the source of the memory leak. If you care less about the top-line memory numbers and more about where to look in the code, you may want to use the detached elements view instead.
For example, starting from where we left off above, this is what the detached elements snapshot looks like. These snapshots show you the detached divs as they appear in the code. If you give each div a unique identifier, it will make it even easier to follow this snapshot back to the correct location in your codebase.
The heap snapshots view helps us to verify that there is a problem, while the detached elements view tells us where to look. This takes us 90% of the way to a solution. The final 10% is identifying what type of memory leak we are dealing with and applying the appropriate fix.
Solving Memory Leaks
Once you know what is being leaked out to memory, you’ll want to look at the code around the leaked element for potential root causes. In this final step, it’s helpful to go through a series of if-then pairs to come up with the right solution:
-
If you see an event listener that is not cleaned up, call removeEventListener when it is no longer needed.
-
If you see a setTimeout or setInterval that is not cleaned up, call clearTimeout or clearInterval once it is no longer needed.
-
If you see an unexpected call related to routing, such as calling window.goBack when you should be using your framework’s preferred router component, try using the preferred router component instead. When the page changes in an unexpected way, it is possible for some of its content to be leaked out to memory.
-
If you see variables pointing to JSX or other DOM elements, consider this suspect. Oftentimes, memory leaks caused by this can be fixed by simply setting the variable to null when you are done with it.
-
If you see nested functions around the memory leak, consider that you may have a leak caused by a closure. As noted in this article, these can also be resolved by setting the offending variables to null when you are done with them.
Finally, if you have tried everything and are tearing out your hair, try the nuclear option. Remove blocks of code from your website, one by one, until the memory issue has disappeared. It’s time-intensive, but you will eventually find the offending piece of code.
Often, what you may find if you’ve reached this stage is that the memory leak isn’t your fault at all. It may be caused by a third party you’ve integrated with, whether it be a UI framework, authentication provider, or session replay tool. Because there are so many ways to combine third-party applications, it’s likely that in your career you will come across one of these kinds of memory leaks. Assuming you can get the appropriate support team to fix it, this is actually a great outcome—the memory leak will be resolved, other customers will benefit, and your standing with the third-party vendor will be improved.
Hopefully I’ve underscored the importance of memory management in JavaScript. If you like what you’ve read, please share this article. Or better yet, go forward in your careers proselytizing about the benefits of memory-driven JavaScript development. With any luck, in ten years we can make the internet a quicker, snappier place.
Thanks for reading!